RHTP: Who Got More and Why
What explains each state's award, and how little Year 2 changed
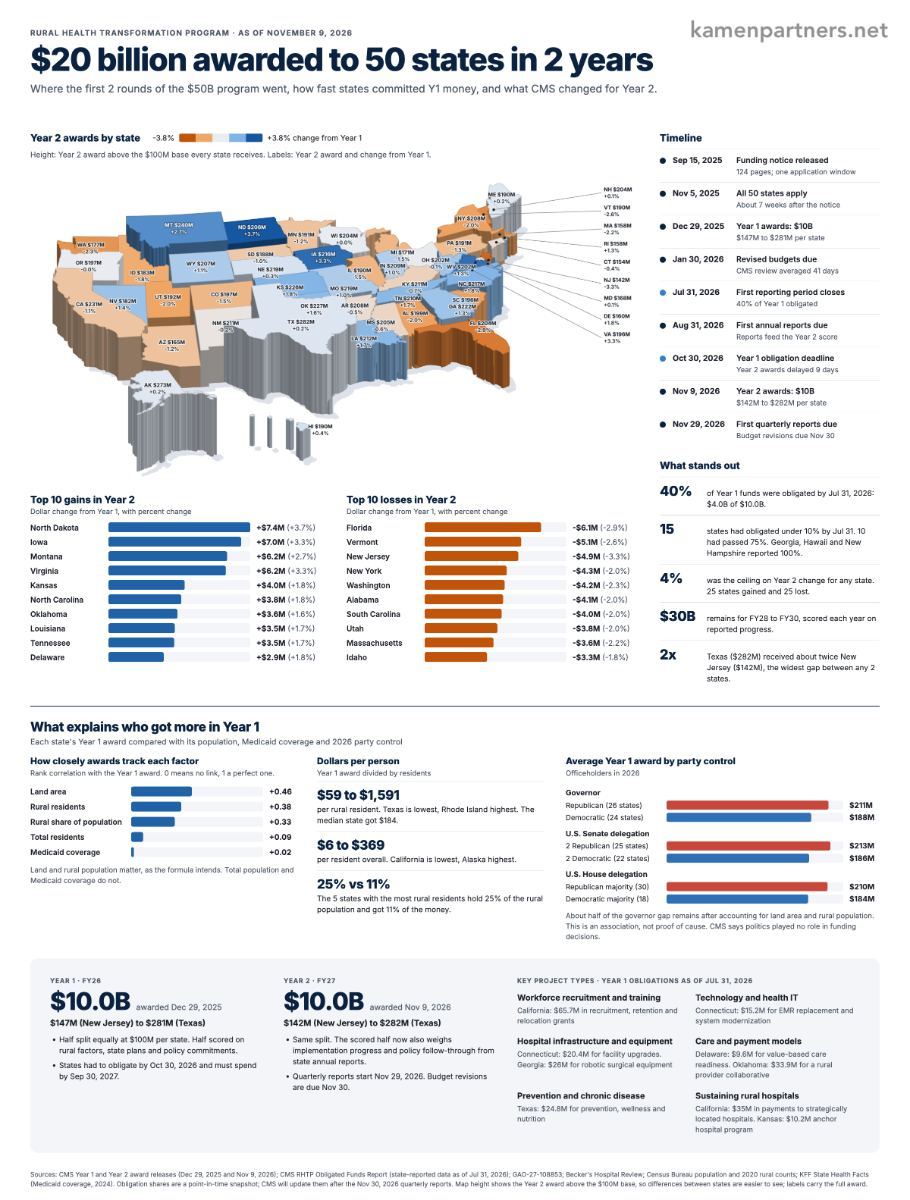
CMS has now awarded $20 billion of the $50 billion Rural Health Transformation Program, $10 billion in each of 2 rounds. Every state got at least $100 million a year. The rest was scored, and the scored half is where states differ: Year 1 awards ran from $147 million in New Jersey to $281 million in Texas.
I lined up each state's Year 1 award against 4 things people assume drive the money: how many people live there, how many of them are rural, how much of the state is on Medicaid, and which party runs it. Two of the 4 turn out not to matter. One matters less than expected. The last one shows a clear gap that needs careful reading.
Rural residents matter, but less than the name suggests
A program called Rural Health Transformation should follow rural people. It does, moderately. The rank correlation between a state's rural population and its Year 1 award is +0.38, where 0 is no link and 1 is a perfect one.
The per-person numbers show how loose that link is.
| Measure | Lowest | Highest | Median state |
|---|---|---|---|
| Year 1 dollars per rural resident | Texas, $59 | Rhode Island, $1,591 | $184 |
| Year 1 dollars per resident overall | California, $6 | Alaska, $369 | $44 |
The 5 states with the most rural residents (Texas, North Carolina, Pennsylvania, Ohio and Georgia) hold 25% of the country's rural population. They received 11% of the money.
The cause is structural. Half of every year's $10 billion is split evenly, so Rhode Island and Texas start with the same $100 million. KFF's review of the formula points to that equal split as the main reason awards vary far less than rural populations do.
Total population and Medicaid coverage do not matter
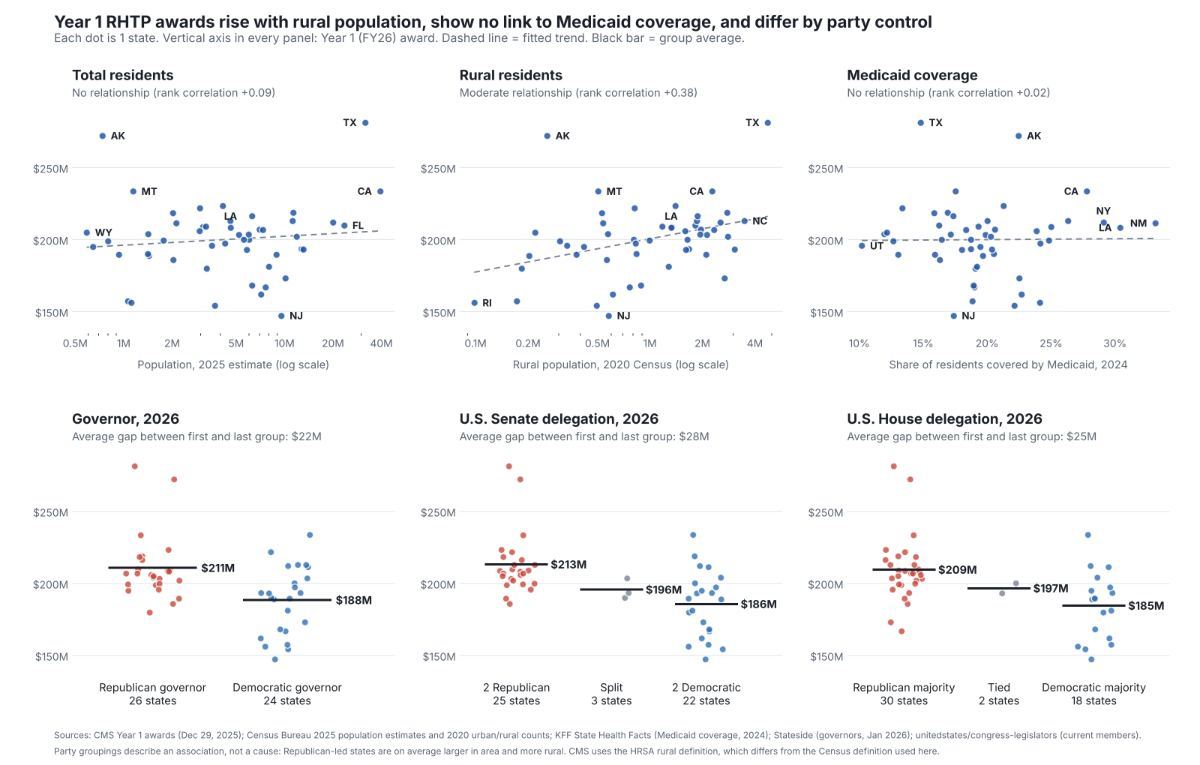
Big states did not get big awards. The rank correlation between total population and the Year 1 award is +0.09, which is statistically indistinguishable from nothing. Texas and California sit near the top, but Florida, New York, Pennsylvania and Ohio are in the middle of the pack, and New Jersey, with 9.5 million people, got the smallest award of all.
Medicaid coverage is the more surprising blank. The program was created alongside large Medicaid cuts, and many people expected the money to flow toward states with the most exposure. It did not. The correlation between the share of residents on Medicaid and the award is +0.02. Louisiana, where 30% of residents are covered, and New Mexico, at 33%, received about the same as Wyoming at 12% and North Dakota at 13%.
That is consistent with how the fund was designed: no part of the formula measures Medicaid enrollment. It is still worth saying plainly, because the program is often described as an offset to the Medicaid changes. At the state level, the dollars do not track where those changes land.
CMS Year 2 Awards: Interactive Visual
Rural Health Transformation Program awards to all 50 states, Year 1 (FY26) and Year 2 (FY27), with the factors that do and do not explain them.
Map, drivers and rankings for all 50 states. Half of each year is split evenly, so land area and rural population explain more of the gap between states than total population or Medicaid coverage.
- Half of each year's $10 billion is split evenly, so every state starts with $100 million.
- Land area lines up with awards best; total population and Medicaid coverage do not.
- Year 2 moved no state more than 4%, and Texas still received about twice what New Jersey did.
Land is the strongest single factor
Of everything I tested, land area lines up with the award best: a rank correlation of +0.46, and +0.70 when area is measured on a log scale. Texas, Alaska, California and Montana are the 4 largest awards and 4 of the 5 largest states.
This is the formula working as written. KFF notes that the need-based portion counts land area and gives an extra allocation to the 5 largest states, and that several measures favor states with a high rural share but few rural residents, such as Alaska, North Dakota and Wyoming. Distance is a real cost in rural care, so the logic is defensible. The effect is that square miles count for more than people.
Party control: a clear gap, and 3 ways to read it
States led by Republicans received more on average, whichever office you look at.
| Grouping, 2026 officeholders | Average Year 1 award | Gap |
|---|---|---|
| Republican governor (26 states) vs Democratic (24) | $210.7M vs $188.4M | $22M |
| 2 Republican U.S. senators (25) vs 2 Democratic (22) | $213.2M vs $185.6M | $28M |
| Republican U.S. House majority (30) vs Democratic (18) | $209.5M vs $184.5M | $25M |
10 of the 12 smallest awards went to states with Democratic governors. The gaps are large enough that chance is an unlikely explanation.
What the gap means is a separate question, and the data supports more than one answer.
- Geography explains part of it. Republican-led states are on average larger and more rural, and the formula rewards both. When I hold land area, rural population and rural share constant, the governor gap falls from $22 million to about $12 million and is only borderline significant. The House gap disappears entirely.
- Policy scoring may explain more. Part of the scored half rewards state policy actions the administration prioritizes. States aligned with those priorities would score higher without anyone favoring a party.
- Discretion cannot be ruled out from this data. CMS does not publish the scores. KFF Health News reported the same pattern from an academic breakdown of the awards. A CMS spokesperson told the outlet that politics played no role in funding decisions.
The defensible summary: there is an association, about half of it is geography, and the rest cannot be attributed without the scoring detail.
Year 2 barely reshuffled the order
CMS announced Year 2 awards on November 9, 2026, with state progress counted for the first time. No state moved more than 4%. 25 gained and 25 lost.
| Largest gains | Change | Largest losses | Change |
|---|---|---|---|
| North Dakota | +$7.4M (+3.7%) | Florida | -$6.1M (-2.9%) |
| Iowa | +$7.0M (+3.3%) | Vermont | -$5.1M (-2.6%) |
| Montana | +$6.2M (+2.7%) | New Jersey | -$4.9M (-3.3%) |
| Virginia | +$6.2M (+3.3%) | New York | -$4.3M (-2.0%) |
| Kansas | +$4.0M (+1.8%) | Washington | -$4.2M (-2.3%) |
The party pattern is fainter here. 16 of 26 Republican-governed states gained, against 9 of 24 Democratic ones, but the average difference is under $1.5 million and not statistically significant. Florida, the biggest loser, and North Dakota, the biggest winner, both have Republican governors.
What this means for a state
Louisiana is a useful test case. Its Year 1 award of $208.4 million works out to $45 per resident and $157 per rural resident, a little under the median on the rural measure. A simple model using rural population, land area, rural share and governor's party predicts Louisiana's award almost to the dollar. The state was neither favored nor shortchanged in Year 1. Its $3.5 million gain in Year 2, the 8th largest, came in the round where progress started to count.
Three things follow for any state office planning the next 3 rounds.
- The fixed inputs are fixed. Land area and rural population will not change, and they explain more than half of the variation between states.
- The movable part is small today and likely to grow. Year 2 capped changes near 4%. With quarterly reports now feeding the score, later rounds have more room to move.
- Medicaid exposure earns nothing in this formula. States counting on the fund to backfill coverage losses should plan around what the dollars can be used for, which is transformation projects and not payment replacement.
Method and sources
All figures compare 50 states. Correlations are Spearman rank correlations with the Year 1 award. The adjusted party gap comes from a linear regression of the award on log rural population, log land area, rural share and a governor indicator. Rural counts use the Census Bureau's 2020 definition; CMS uses HRSA's, which counts fewer rural residents in some states. Party control reflects officeholders in 2026; Virginia's governor was a Republican when Year 1 awards were made. Land area was calculated from state boundary files.
- CMS Year 1 awards (Dec 29, 2025)
- CMS Year 2 awards (Nov 9, 2026)
- KFF, A Closer Look at the $50 Billion Rural Health Transformation Program
- KFF Health News, States Race To Launch Rural Health Transformation Plans
- KFF State Health Facts, Health Insurance Coverage of the Total Population (2024)
- State population estimates, July 1, 2025
- Stateside, 2026 Governors
- unitedstates/congress-legislators, current members of Congress
- Census Bureau, 2020 urban and rural population by state
Two Views of the Rural Health Fund
Related Award Data and Funding Formula analysis: CMS has now awarded $20 billion of the $50 billion Rural Health Transformation Program. Round 1 went out in December 2025, round 2 o…
RHTP Year 2: What Changed?
Related Award Data analysis: CMS's Year 2 RHTP awards kept every state within 4% of Year 1, but the money now follows execution: annual reports, policy follow-th…
RHTP is at least the fifth attempt to fix rural health care. Here's what the first four bought.
I spent most of this year helping stand up a state Rural Health Transformation Program office in Louisiana, and I left that role las…